Automating Package Tracking for BLUE Versions: A Journey to Efficient Data Management
Ridho Anandamal
Background
We have three versions of BLUE: BLUE 2 External, BLUE 2 Internal, and BLUE 3. Our goal is to track which version is currently in use.
Currently, Product Designers and UX Engineers manually monitor package installations by consulting with Product Designer tribes about the components they utilize and the BLUE version they are using. However, BLUE 3 employs a distinct versioning system where each component has its own version—such as button 3.0.4 and banner 3.0.5. This approach is inefficient since designers do not track individual package versions.
This prompted us to explore the possibility of automating the tracking of package versions across repositories, without depending on designers or developers.
Consulting with R&D Tech
Given that UX Engineers lack expertise in data management, we sought advice from Pak Hidayat of the R&D Front-end team. He informed us that the R&D team already collects package installation data. He guided us through their process and recommended that we engage with the Data Analyst Team for further discussions.
Before diving into the data, we needed to acquire a foundational understanding of SQL. Fortunately, the Data Team offers a brief bootcamp for non-data team members, including PMs, PDs, and UX Engineers. After completing the bootcamp, we requested access to Google Cloud Platform (GCP) for the UX team, where we enabled BigQuery and Looker Studio.
Next, we concentrated on connecting and cleansing the data, which is detailed in the following sections.
Concept and Flow
The tracking concept operates as follows:
- Before developers release to production, they must build the project in Jenkins.
- Within Jenkins, the R&D team has added a script to generate an SBOM (Software Bill of Materials).
- Following a successful build, SBOM data is stored as an object-based structure in BigQuery.
- Since BigQuery is optimized for table-based data, we collaborated with Data Engineers to convert the SBOM object-based data into a structured table.
- After this conversion, our team can freely utilize the data. The rest is here.

Data Cleansing in BigQuery
Although we received SBOM data from R&D, it required cleansing before we could effectively use it in charts and reports.
Why Clean the Data?
Data scientists often spend 80% of their time on data cleaning, as raw data can contain inconsistencies, duplicates, or missing values. Using unprocessed data can lead to inaccurate charts and misleading insights.
How We Cleaned the Data
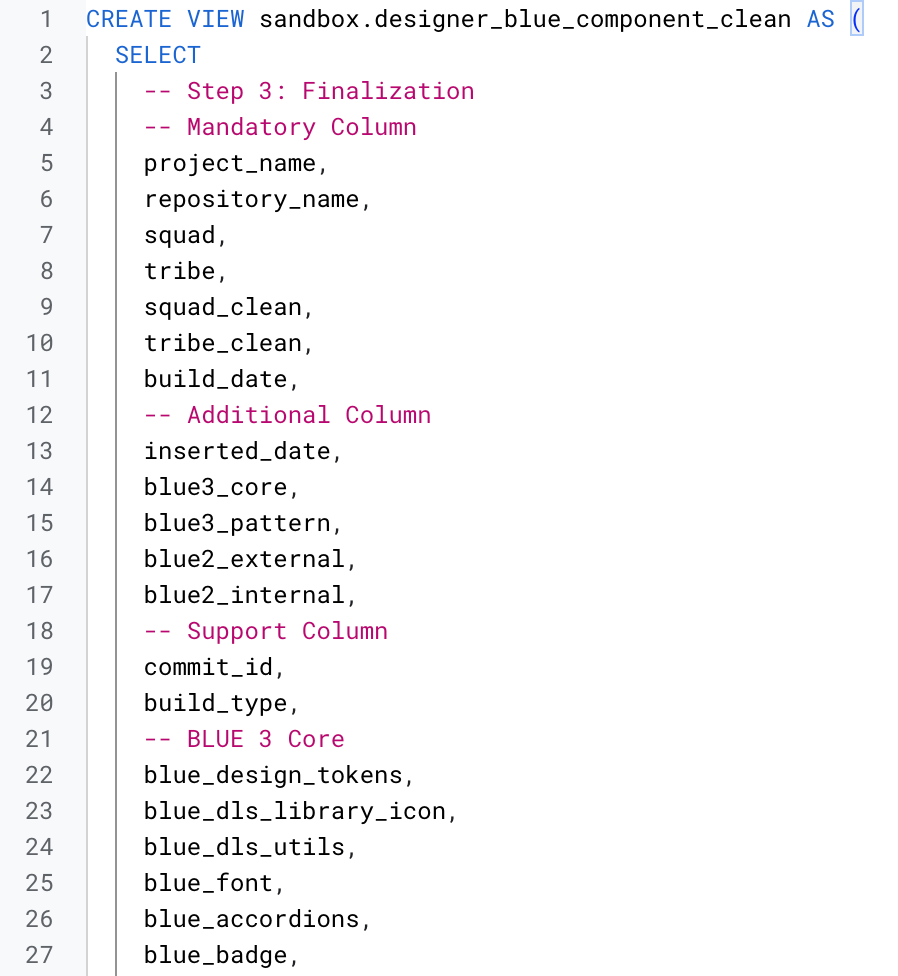
The most common method for data cleaning is using Python (Pandas library); however, since we couldn't enable Python and lacked expertise in it, we relied on SQL queries instead.
Here’s an example of how we cleaned the data in BigQuery:
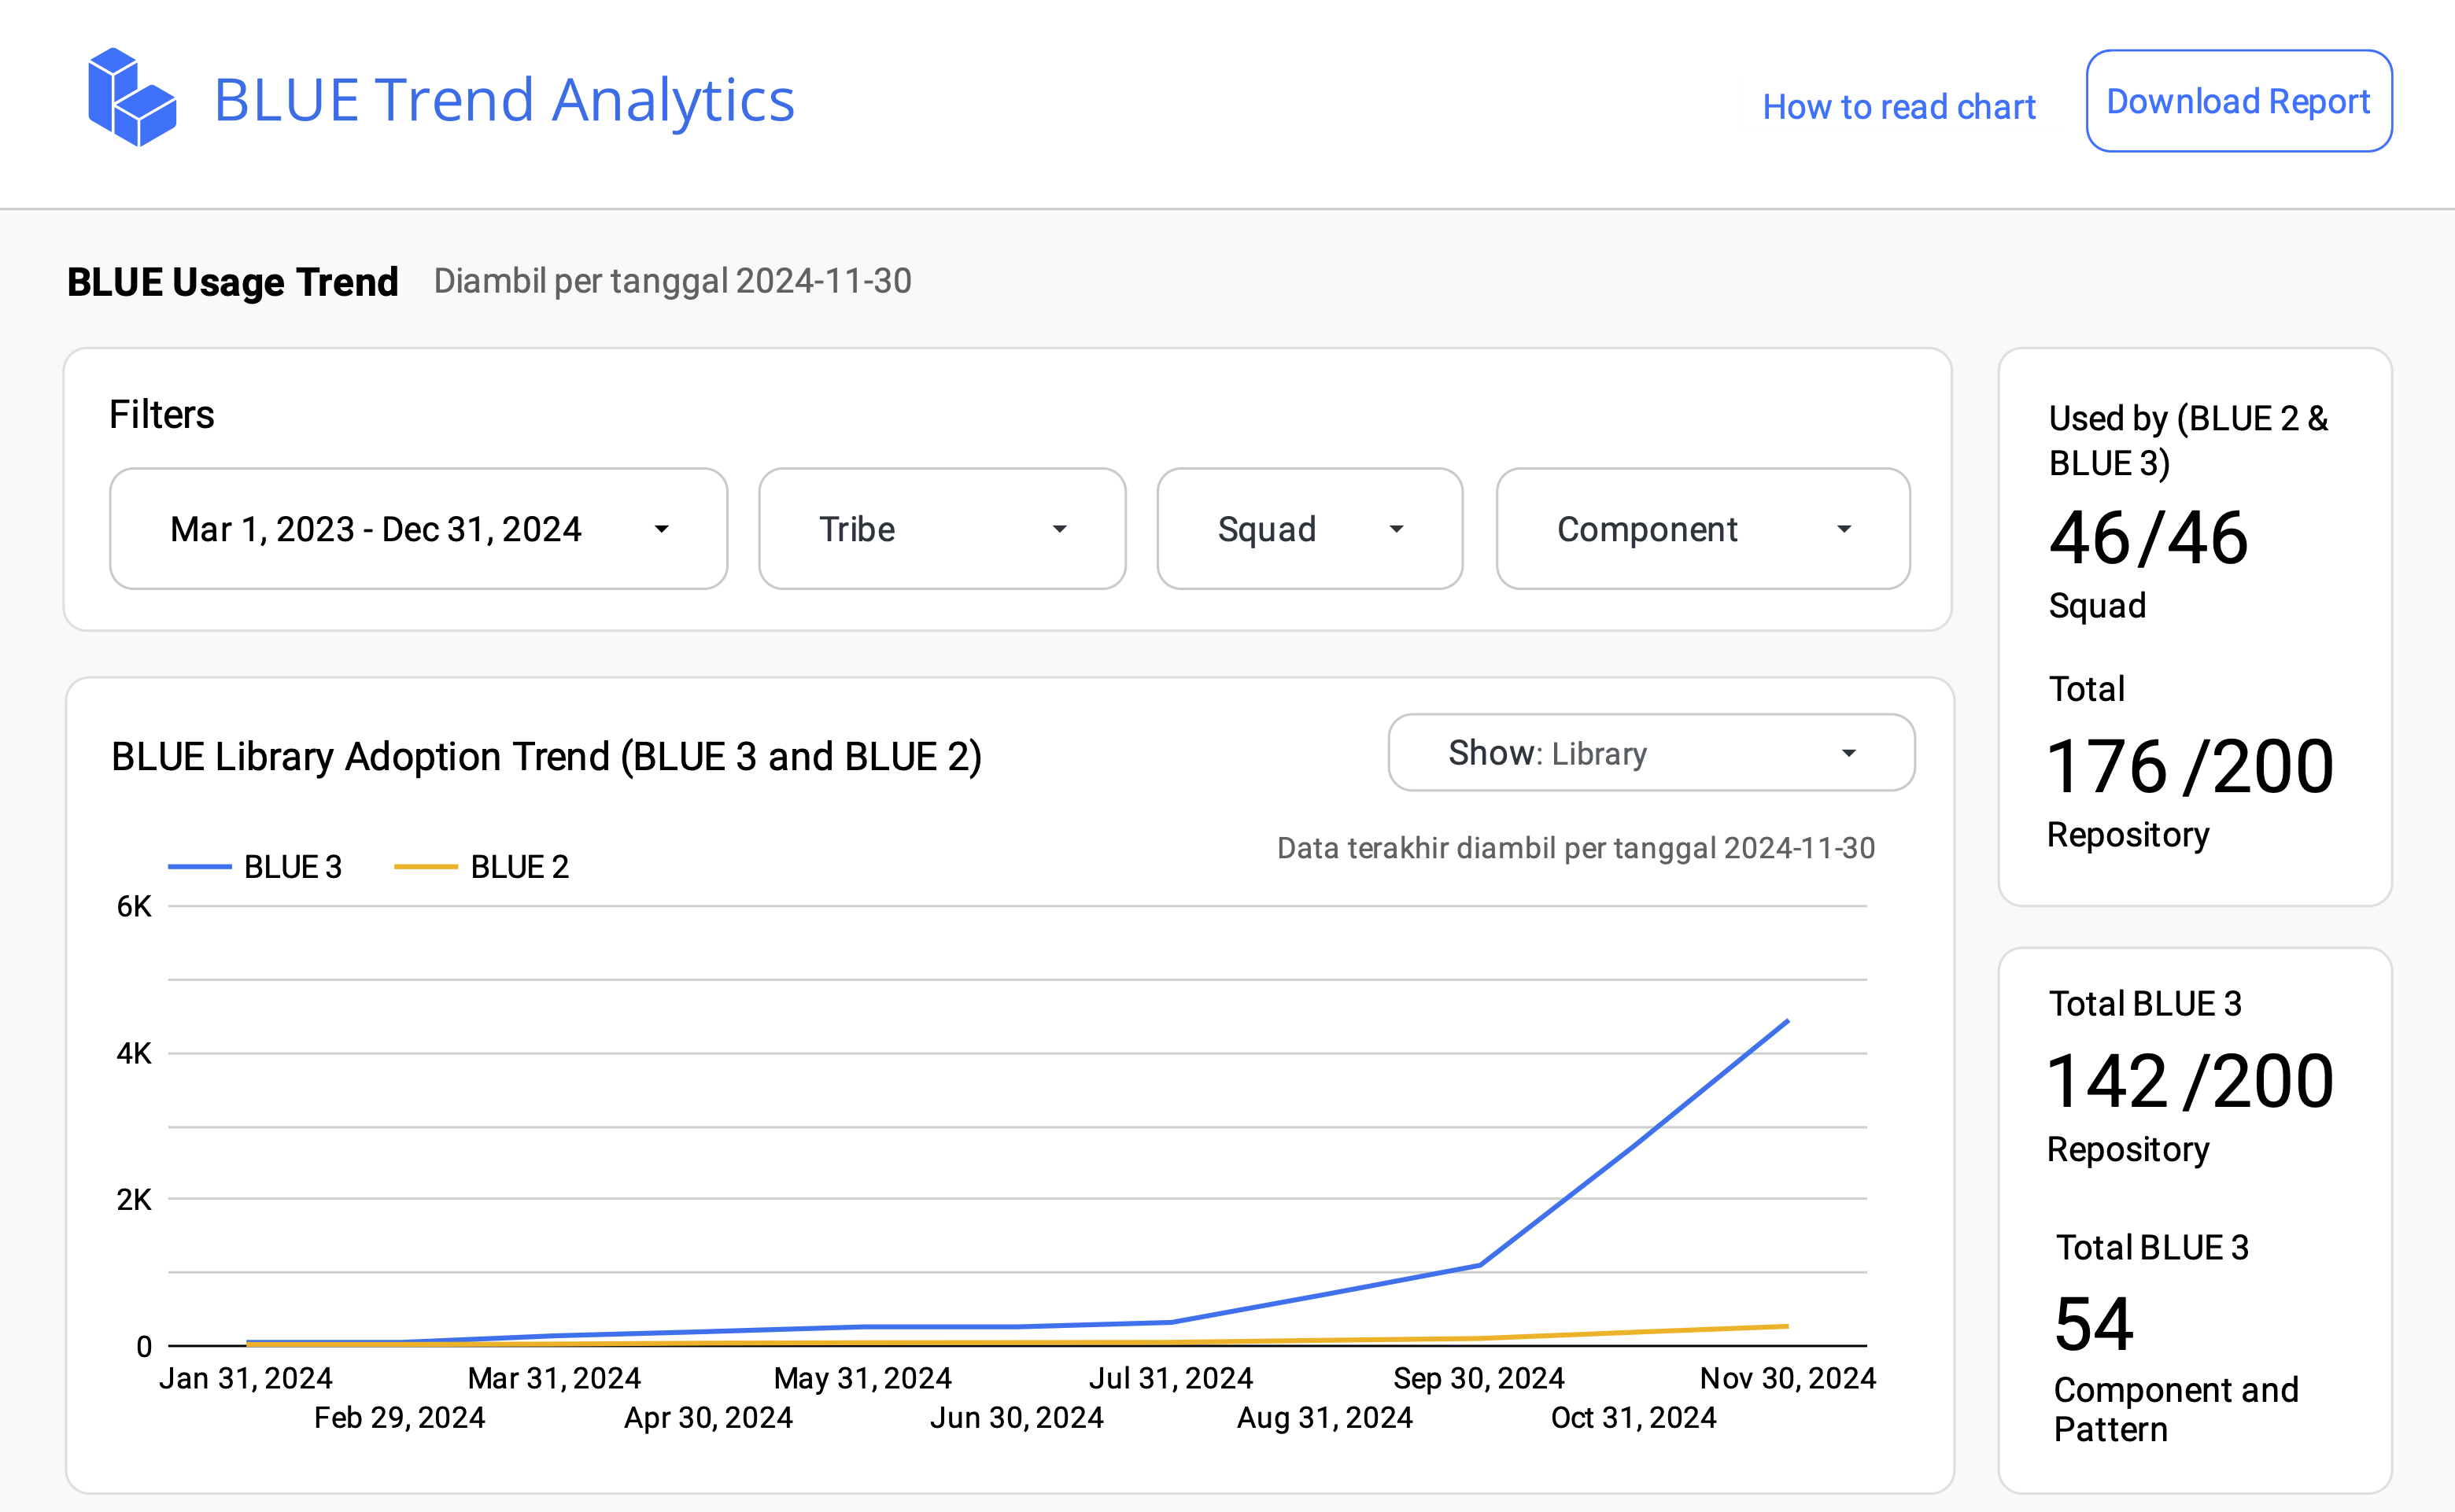
Creating a Dashboard with Looker Studio
To enhance data readability and visual accessibility, we utilized Looker Studio to create dashboards. Here’s what we explored regarding Looker Studio capabilities:
- We experimented with various chart types to determine the most effective representation of package usage data.
- We optimized BigQuery queries to ensure smooth data retrieval in Looker Studio.
- We adjusted data structures in BigQuery to allow efficient access and processing by Looker Studio.
This is just a sample section.
Presenting to Designers
After constructing the dashboard, we presented it to the BLUE Designer team to gather feedback from a non-technical perspective. Their insights were invaluable in refining the dashboard to be more user-friendly for individuals without a technical background.
During our discussions, we identified several areas for improvement, leading to our final user-friendly dashboard.
Challenges and Lessons Learned
Throughout this project, we faced several challenges:
- Mismatched Requirements and Source Data:
- The raw data we received from R&D did not fully align with our tracking needs.
- We had to manipulate and restructure the data to meet our requirements.
- Data Cleansing Issues:
- Incorrectly cleaned data resulted in misleading charts.
- We needed to ensure proper data validation before utilizing it in visualizations.
- Communicating Data Insights to Designers:
- As designers are non-technical, we had to present data in an intuitive manner.
- We simplified visual representations and added clear labels to the dashboard.
- Looker Studio Technical Limitations:
- Some features we required were not available in Looker Studio.
- We adjusted BigQuery structures to compensate for these limitations.
Conclusion
After nine months of dedicated work, we successfully automated package tracking for BLUE 2 and BLUE 3, eliminating the need for manual tracking.
- We structured BigQuery tables to efficiently store SBOM data.
- We cleaned and processed data using SQL queries.
- We built an automated dashboard in Looker Studio for straightforward tracking.
This project not only enhanced tracking but also provided us with valuable experience in data management, SQL, and dashboard creation.
Special thanks to:
- Cak Sony (UX Engineer Lead) and Ci Stipi (BLUE Lead)
- Pak Hidayat (R&D Front-end) for his technical guidance.
- The Data Team for the SQL bootcamp and data support.
- The BLUE Designers for their valuable feedback on usability.